Available Soil Water
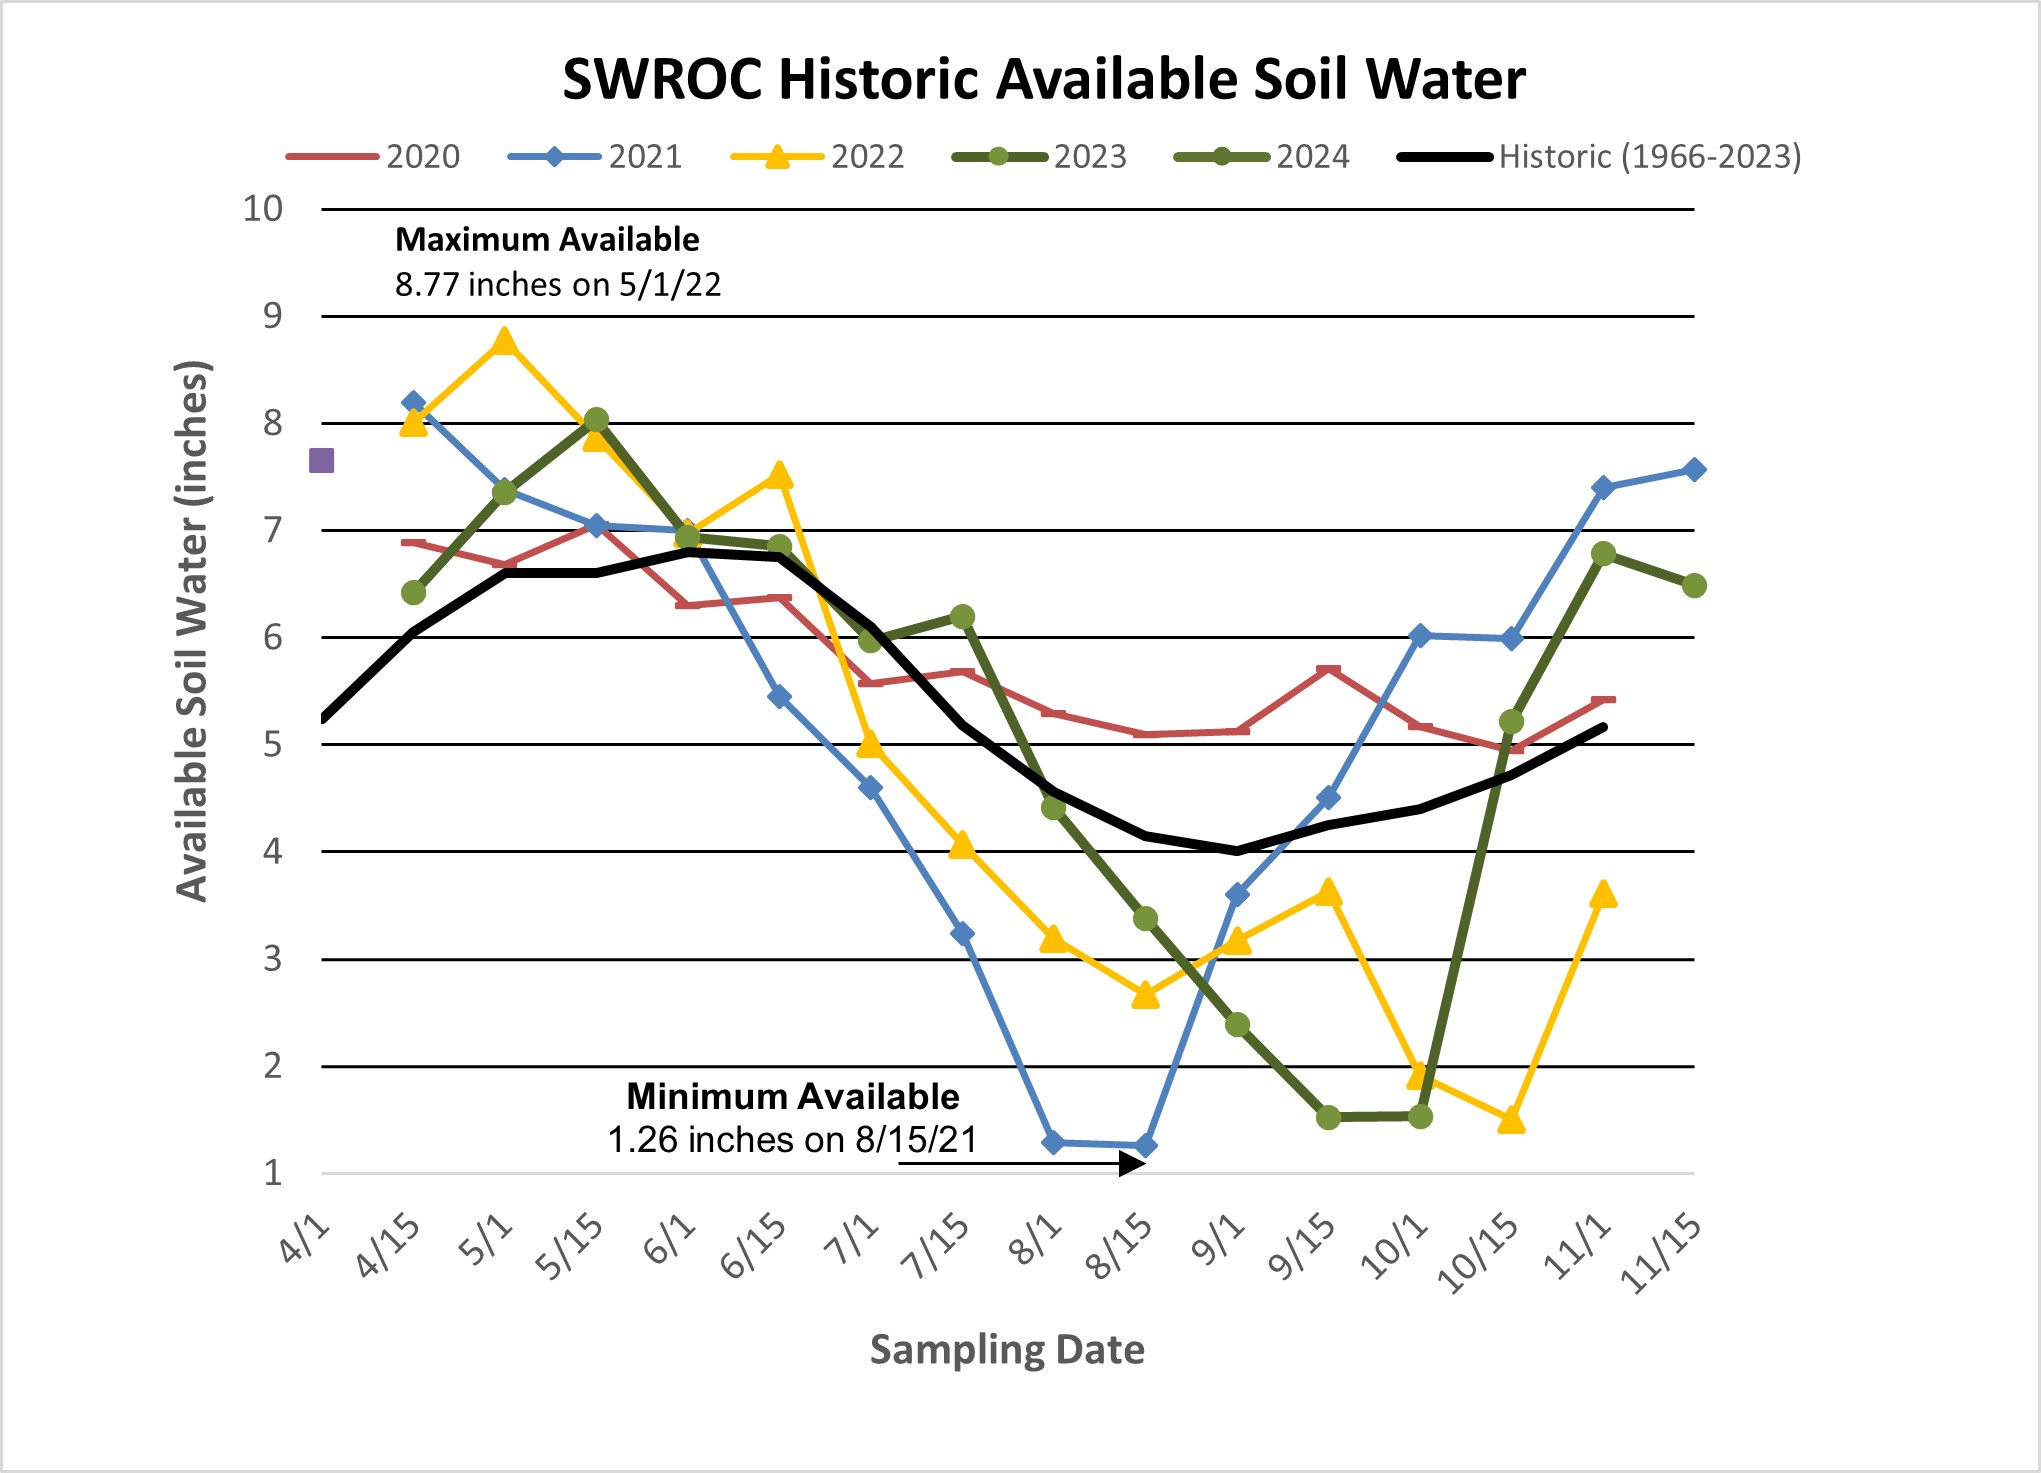
2020 - 2024 Soil Water vs. Historic Average (1966-2023)
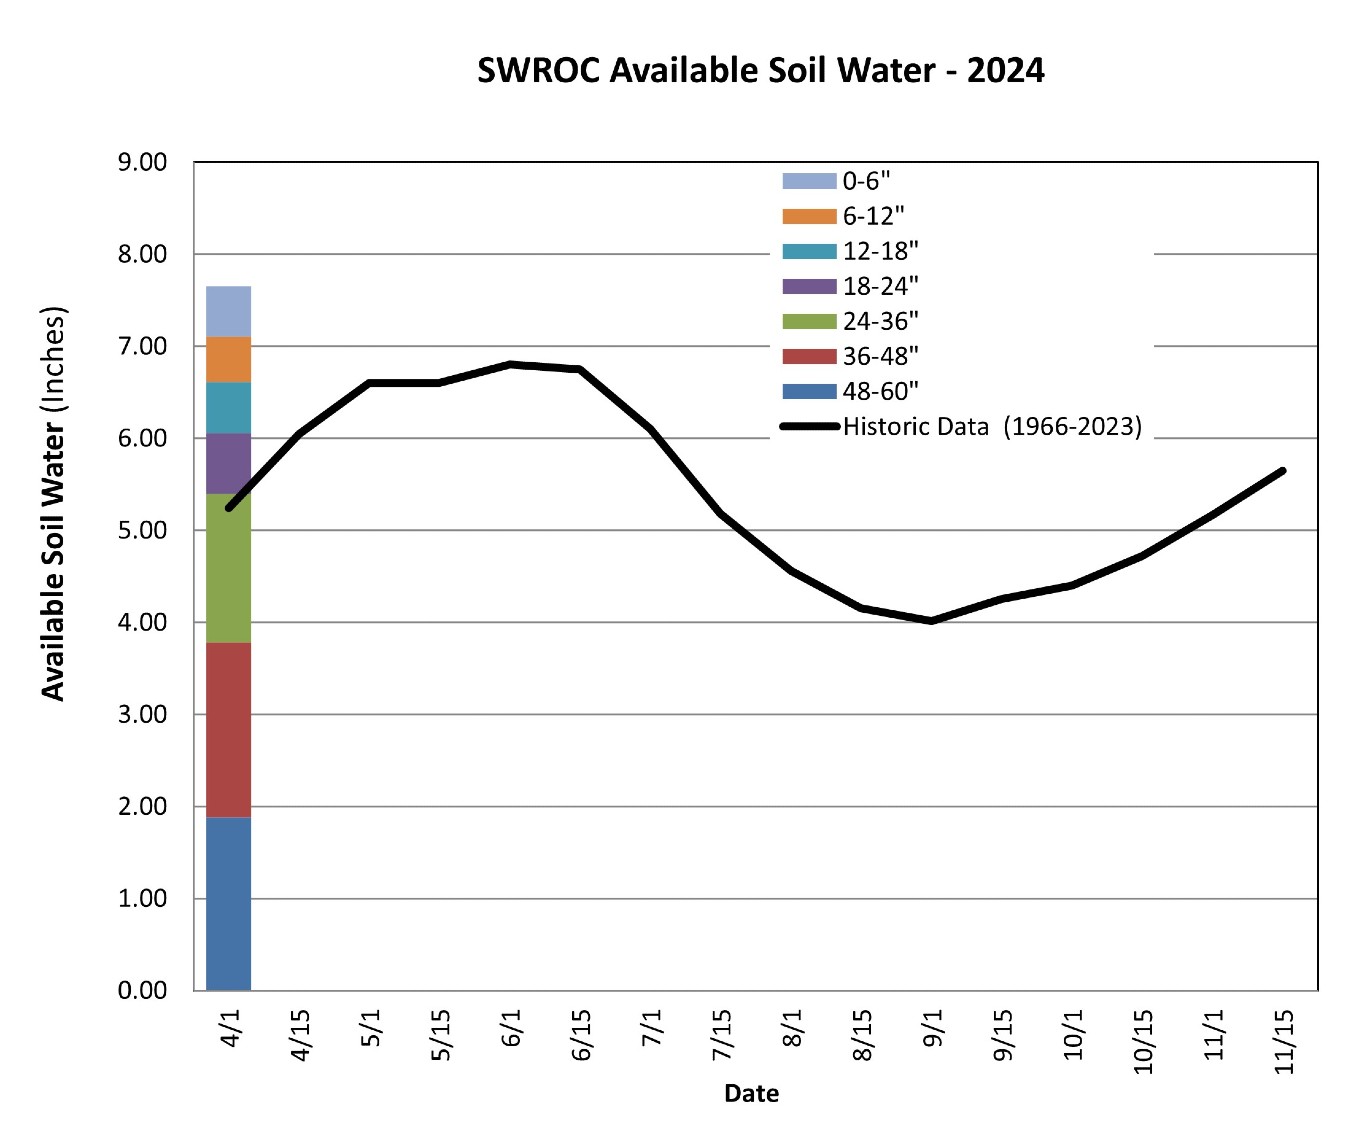
2024 Available Soil Water vs. Historic Average (1966 - 2023)
| Date | 0-6" | 6-12" | 12-18" | 18-24" | 24-36" | 36-48" | 48-60" | Total | Historic |
| 04/01/2024 | 0.55" | 0.49" | 0.56" | 0.66" | 1.61" | 1.90" | 1.88" | 7.65" | 5.24" |
| 04/15/2024 | | | | | | | | | 6.05" |
| 05/01/2024 | | | | | | | | | 6.60" |
| 05/15/2024 | | | | | | | | | 6.60" |
| 06/01/2024 | | | | | | | | | 6.80" |
| 06/15/2024 | | | | | | | | | 6.75" |
| 07/01/2024 | | | | | | | | | 6.10" |
| 07/15/2024 | | | | | | | | | 5.18" |
| 08/01/2024 | | | | | | | | | 4.56" |
| 08/15/2024 | | | | | | | | | 4.15" |
| 09/01/2024 | | | | | | | | | 4.01" |
| 09/15/2024 | | | | | | | | | 4.25" |
| 10/01/2024 | | | | | | | | | 4.40" |
| 10/15/2024 | | | | | | | | | 4.72" |
| 11/01/2024 | | | | | | | | | 5.17" |
| 11/15/2024 | | | | | | | | | 5.65" |
Negative values are below the wilting point on a plant.
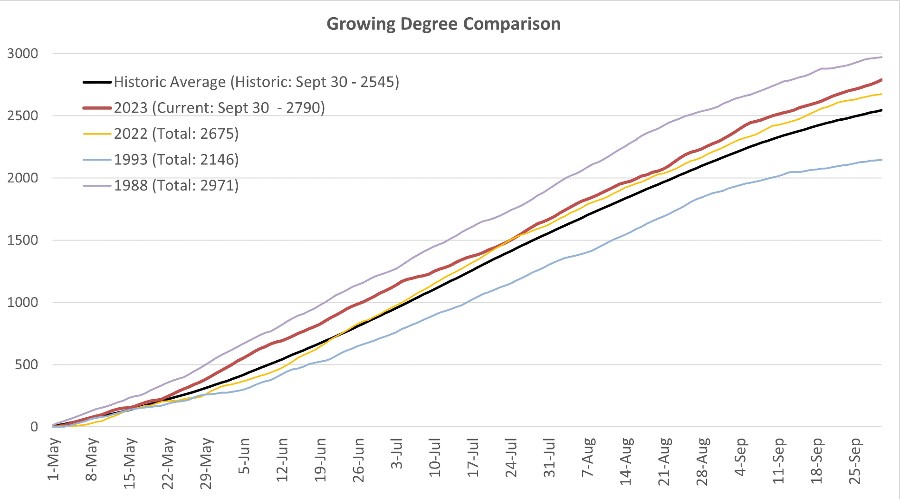
2023 Growing Degree Day Comparison
| Date | 2023 GDD | 2022 GDU | 1993 GDU | 1988 GDU | Historic GDU |
| Aug 10 | 1887 | 1834 | 1464 | 2149 | 1759 |
| Aug 18 | 2027 | 1987 | 1633 | 2363 | 1912 |
| Aug 31 | 2293 | 2227 | 1888 | 2575 | 2149 |
| Sept 14 | 2546 | 2461 | 2049 | 2796 | 2367 |
| Sept 30 | 2790 | 2675 | 2146 | 2971 | 2545 |
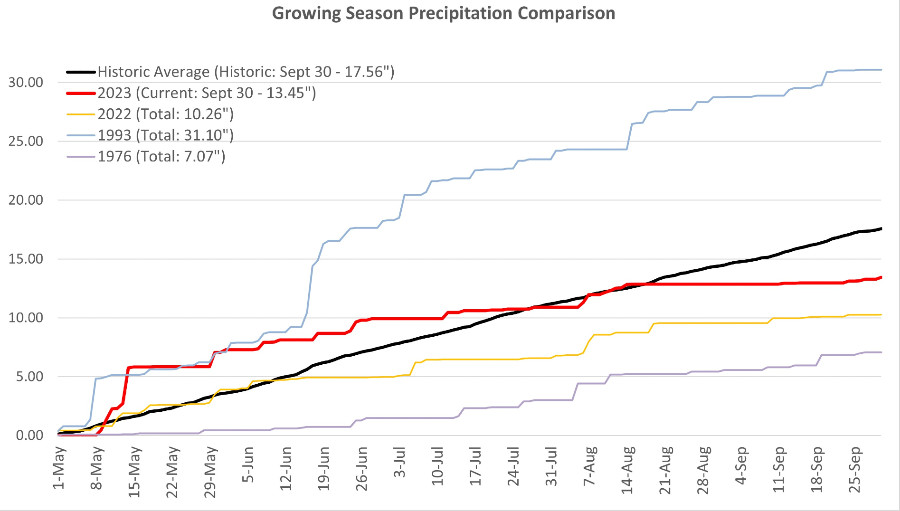
2023 Growing Season Precipitation Comparison
| Date | 2023 | 2022 | 1993 | 1976 | Historic |
| Aug 10 | 12.16" | 8.56" | 24.32" | 4.42" | 12.24" |
| Aug 18 | 12.85" | 8.74": | 27.41" | 5.22" | 12.92" |
| Aug 31 | 12.85" | 5.94" | 28.75" | 5.42" | 14.41" |
| Sept 14 | 12.86" | 9.98" | 29.54" | 5.95" | 15.85" |
| Sept 30 | 13.45" | 10.26" | 31.10" | 7.07" | 17.56" |


